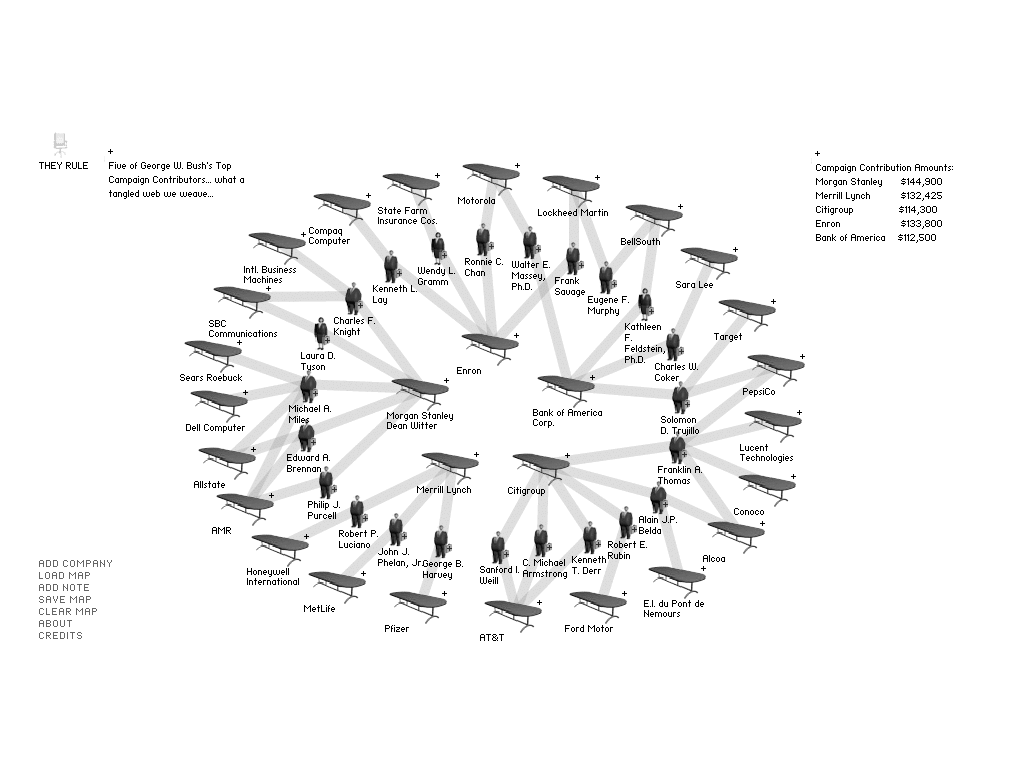
Josh On, They rule: http://www.theyrule.net/
The following are the notes of my presentation, part of a workshop at ADRI on October 3, 2017. They are made available on Remix Data for those who attended the workshop, and for anyone online who may be interested in data visualization as a creative tool. The notes are meant to function as an entry point for anyone who is not familiar with data visualization, but hopefully, even those who are well acquainted will find relevant some of the concepts, and especially the examples discussed. You can download the technical tutorials of SVGs and a basic bar chart developed with D3, which were discussed at the end of the workshop:
This session focuses on how data visualization relates to creative practice. First I will go over the basics of data visualization to then provide a few examples of artists, designers and researchers who have implemented some form of data visualization to produce creative works of art or design.
Three basic media forms to analyze:
Image
Sound
Text
No matter which type of form is analyzed, the data usually will be organized as textual data that can then be visualized and represented in some way.
The data in turn can also be represented in the three forms
Image (data visualization)
Sound (sonification)
Text (datasheets)
There are many tools available for analysis at this point, for this reason one should become familiar with as many related to one’s interests before deciding to engage in advanced development.
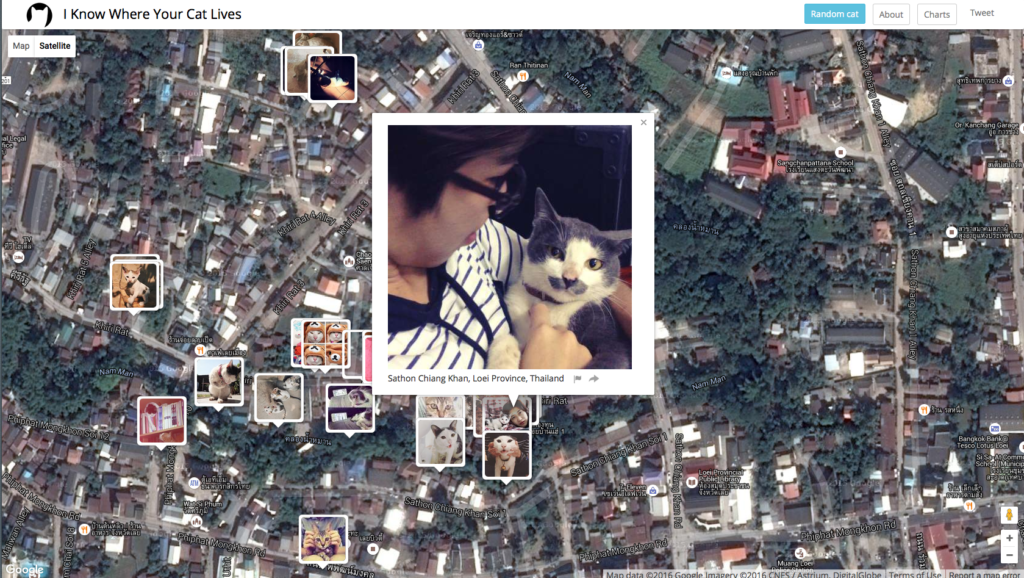
Owen Mundy: https://owenmundy.com/
One thing to keep in mind is that information based production, which is the platform that informs our way of working at the moment, consists of key stages, which include:
- An early stage in which the development took place by institutions and corporations that had major resources. This time goes back to the days when ENIAC was developed in 1945. In this case it was the military and a Research University (The Moore School at U Penn) that developed a room sized computer.
- The next stage consisted of the privatization and commercialization of computing, leading to the culture of the 1960s closely linked with Xerox PARC in the Bay area of California.
- The next stage would lead to principles of open source throughout the 1970s which now inform our current culture. This stage is what made the Internet possible.
- The attitude found in open source in effect is the backbone of contemporary collaborative production manifested in the arts and humanities as new media culture throughout the nineties to mid-2000s, which has now evolved in academia into the interdisciplinary field of the Digital Humanities.
- Our current stage can be considered “Permanently Beta,” (a term I borrow from Gina Neff and David Stark). [1] The term points to the second of two ways of working:
1) The first is using tools that are available, as one would use established software such as Photoshop, Illustrator, etc.
2) The other is developing tools for one’s research that are shared with others for possible enhancement based on their own research interests. (It must be noted that the permanently beta principle is encouraged and promoted by corporations in order to get feedback as well as ongoing development based on a crowd sourcing model closely intertwined at this point with social media.) - In effect, the scholarship of the digital humanities is largely focused on how technology can be used for the evaluation and better understanding of cultural production.
One thing that I find Digital Humanists should be aware of is of becoming too focused on technological innovation. In effect, one may feel certain pressure, in order to become an established researcher, to develop something that appears technologically innovative as opposed to using tools that may already be available. This could lead to a model of innovation for innovation’s sake, which could be paralleled to moments in the history of art, in terms of “art for art’s sake.”
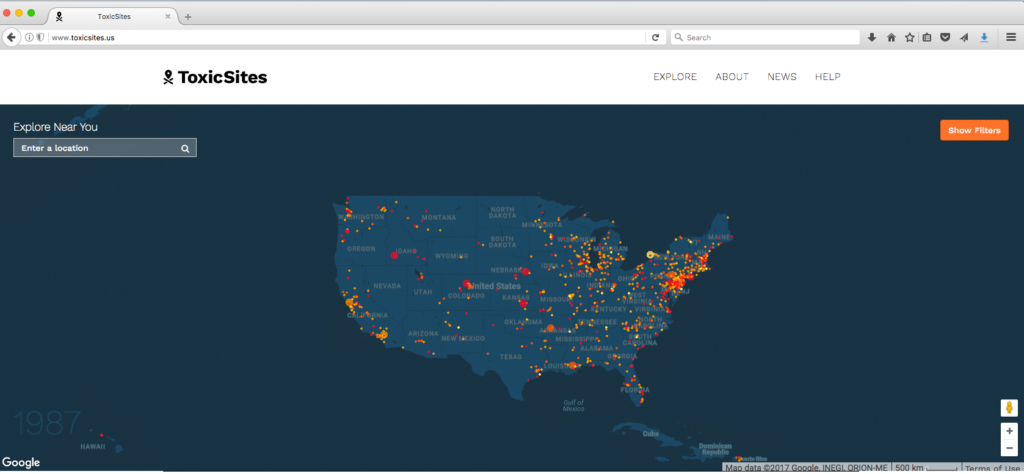
Brooke Singer: http://www.toxicsites.us/
The key thing, then, is to begin with questions that are of real interest to a researcher, and based on those questions, one should search for tools that will be useful. Eventually, one may develop a need for specialized tools which are not available, and that is when one may become an actual developer.
To drive the point home on this issue, in the spirit of remix, I borrow a quote from Charlie Gere, who in turn borrowed it from Gilles Deleuze: “the machine is always social before it is technical. There is always a social machine which selects or assigns the technical elements used.” [2]
If one has never had exposure to Digital Humanities methods, then one may not find how it can be relevant to one’s research. So, one should understand that the questions that may already be informing one’s research can be reshaped once one is exposed to different tools. With this in mind, I will explore some questions that I usually introduce to students who may not be familiar with text-mining or image-mining.
Key Questions for all analysis (image, sound, text):
- How does the data help you evaluate your experience/understanding of the work?
- Does your data analysis expose some elements of the work that you could not perceive by just viewing/reading/listening?
The above questions have embedded the foundational question for any subject: How does “it” work?
To engage with this basic question, one usually will analyze the material (image, sound or text) carefully, then writing down one’s observations, which in theory, others could review and analyze. With data-mining tools, one can actually use quantification to evaluate patterns, to then consider how such patterns may shed light on one’s question, which often times leads to more complex questions on the subject.
This process then consists of four parts:
• Perform research based on a question (image, sound, text)
• Gather data
• Evaluate data
• Represent the data (image, sound, text)
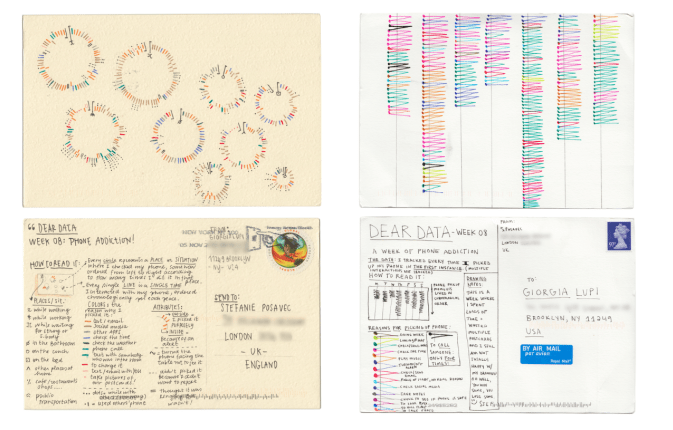
Giorgia Lupi and Stefanie Posavec, Data drawing pen pals, http://www.dear-data.com/
Evidently, this process cannot be covered in one session, so what I will show at this point are a few data visualization examples for image, sound and text, so that we get a sense how this process takes place. Given that this session is about data visualization, I will finish by focusing on the development of basic shapes that can be used to visualize any type of data. This might be basic for people acquainted with web development and programming, but the point is to keep in mind the conceptual process that informs how and why we come to choose certain forms to represent/visualize our research.
Artists and designers have actually used data visualization to produce creative work. Some examples include (discussed with participants during live session):
Josh On, They rule: http://www.theyrule.net/
Owen Mundy: https://owenmundy.com/
Brooke Singer: http://www.toxicsites.us/
Image Visualization as a video presentation:
Josh Begley, Every NYT front page since 1852
https://vimeo.com/204951759
Cyrus Kiani
The Hawaiian Star
https://vimeo.com/37001373
Sound represented visually:
Manny Tan & Kyle McDonald,
Bird Sounds
https://experiments.withgoogle.com/ai/bird-sounds
Dear Data MoMA Collection:
https://medium.com/@giorgialupi/dear-data-has-been-acquired-by-moma-but-this-isnt-what-we-are-most-excited-about-bdaa3376d9db
Entry explaining the process:
Data drawing pen pals
http://flowingdata.com/2015/03/19/data-drawing-pen-pals/
Actual Project
http://www.dear-data.com/
In the spirit of the above examples, particularly the last one, I will focus on basics, because, as you can see, we don’t have to program to begin visualizing information. We can draw our interpretation of data. It is, however, important to eventually program your visualization so that it can reach a fuller potential. What is worth noting here is that when we visualize data, we are actually interpreting it. Data visualization can be a fair presentation of raw data when we consider how and why we choose colors, line shapes, spacing between objects etc. Such basic graphic objects affect how the data is perceived. We must be conscious of this aspect of data visualization, and make sure we are being fair to the project when we decide to use specific visual elements to present factual information.
Data Visualization is in large part developed with SVGs. For this reason, I will go over how basic SVG shapes are developed. It is my experience that having a basic hands on understanding of the foundation of tools one will use helps one develop an intimacy that otherwise will never emerge if we only function as users. In other words, knowing what the code behind tools actually does helps in deciding how to use such tools.
You can download the tutorial if you don’t know how to use SVGs by clicking the links below. A basic bar chart is also included which can help in developing an initial sense of how data viz functions.
footnotes:
[1] Gina Neff and David Stark, http://www.umass.edu/digitalcenter/events/2002Workshop/Papers/stark_permanently.beta.pdf, accessed October 2, 2017
[2] Charlie Gere, Digital Culture, “Introduction,” Digital Culture (London: Reaktion Books, 2008), 17.


